Memory Profiling Library and Viewer
This is a proof of concept library and executable utilities to profile and visualize memory leaks on a program. Directly inspired by the video from The Cherno on YouTube about profiling his game engine.
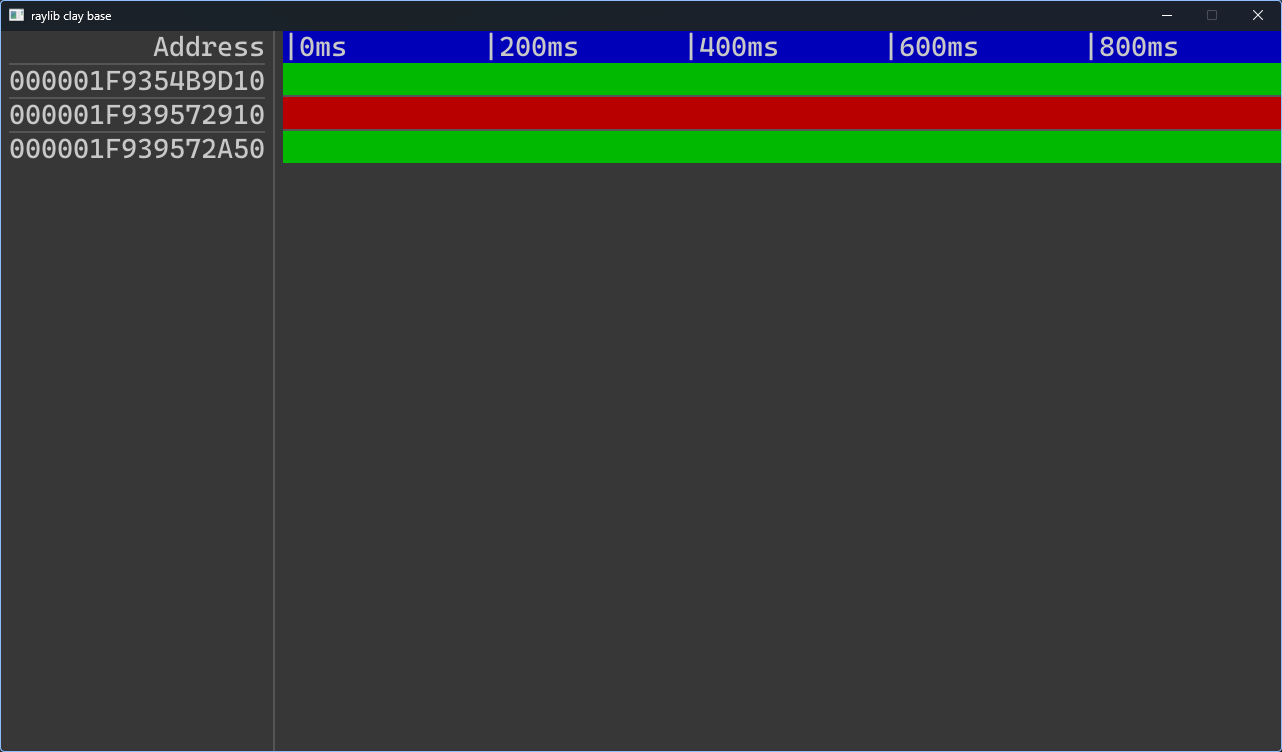
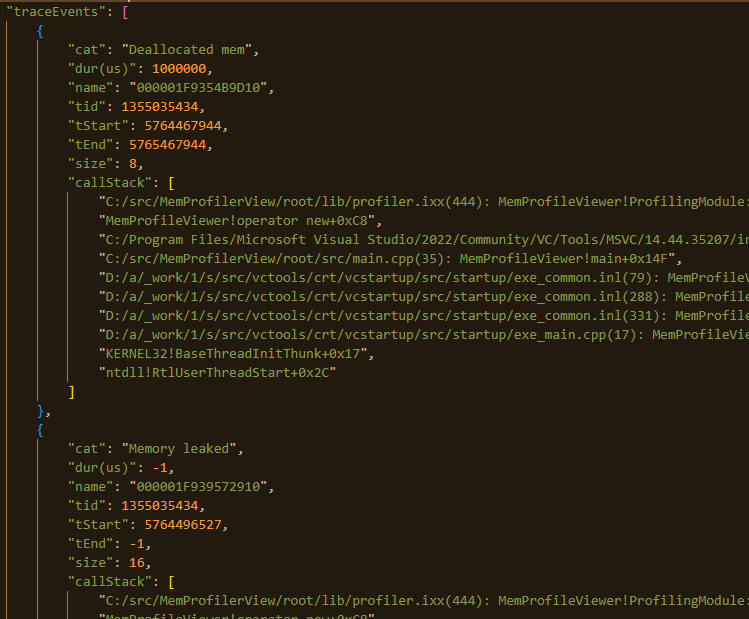
The library allows to profile individual scopes of code and generates json reports with the stack trace of which line of code allocated the memory how long it was allocated for and whether the memory got properly de-allocated or not.
Feel free to explore the code on GitHub.
Please note that while this is open source and I do intend to come back and polish it further, this was mostly an exploratory exercise to use many different technologies.
Technologies Used
This project is mostly an exploration of C++23 and the new modules feature, as well as the other technologies listed bellow.